
Feature · Analytics
Advanced statistics, for those who want to know more.
Reports show individual days. Analytics puts them into a bigger picture: 6 months of revenue, your best days of the week, your best-selling products and your best customers.
Available from the Profesjonalny (Professional) plan - from 189 PLN/month + VAT.
Revenue month by month
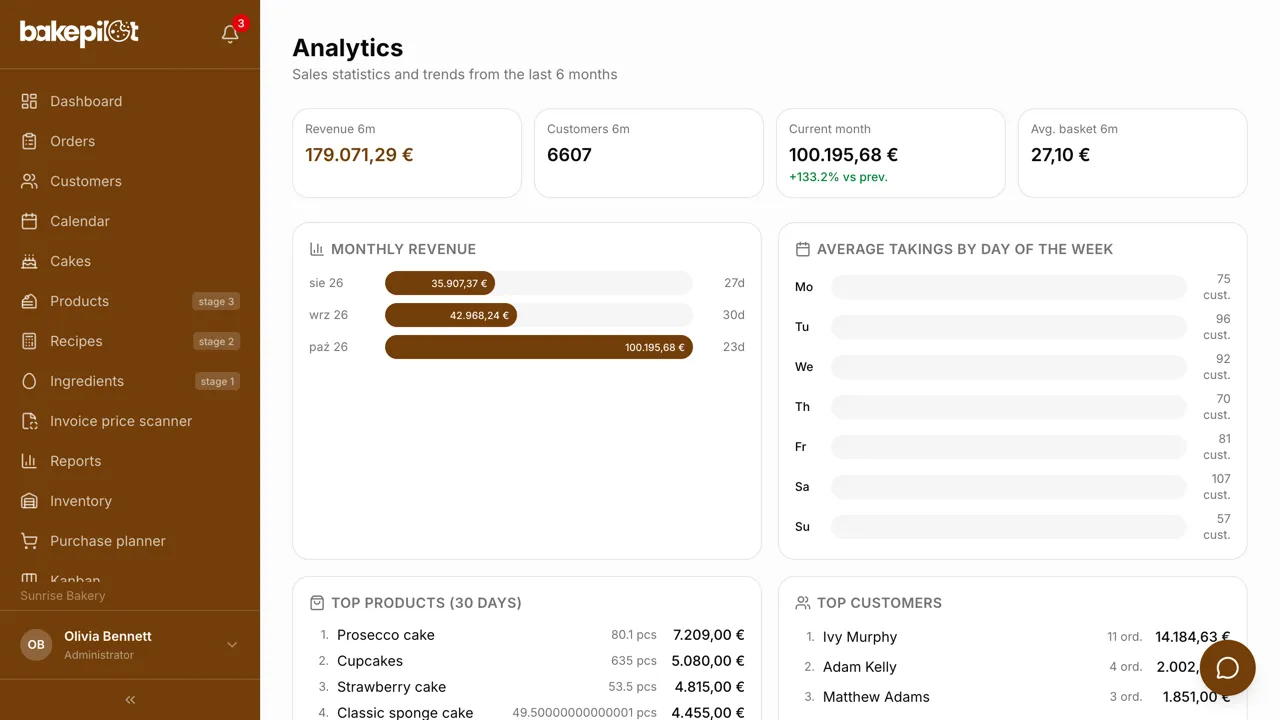
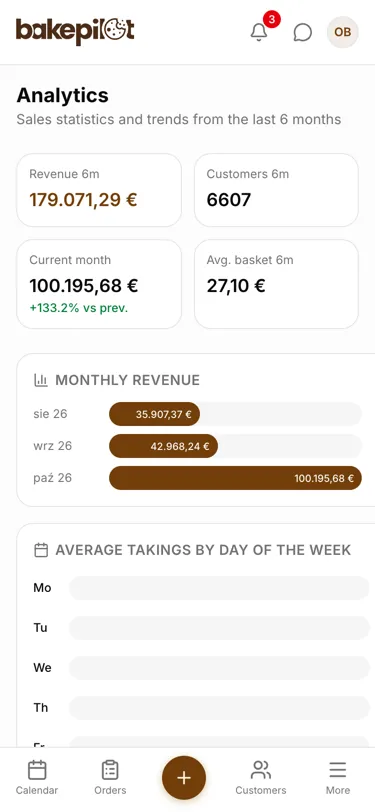
You see how sales change over time. Was December better than November? How does the current month compare with the previous one? Are Fridays your best day? Analytics calculates it from your daily reports.
- Revenue chart for the last 6 months
- Current month against the previous one
- Average takings by day of the week (last 90 days)
- Number of customers and average basket over 6 months
- Data from daily reports, with no extra data entry
Best products and customers
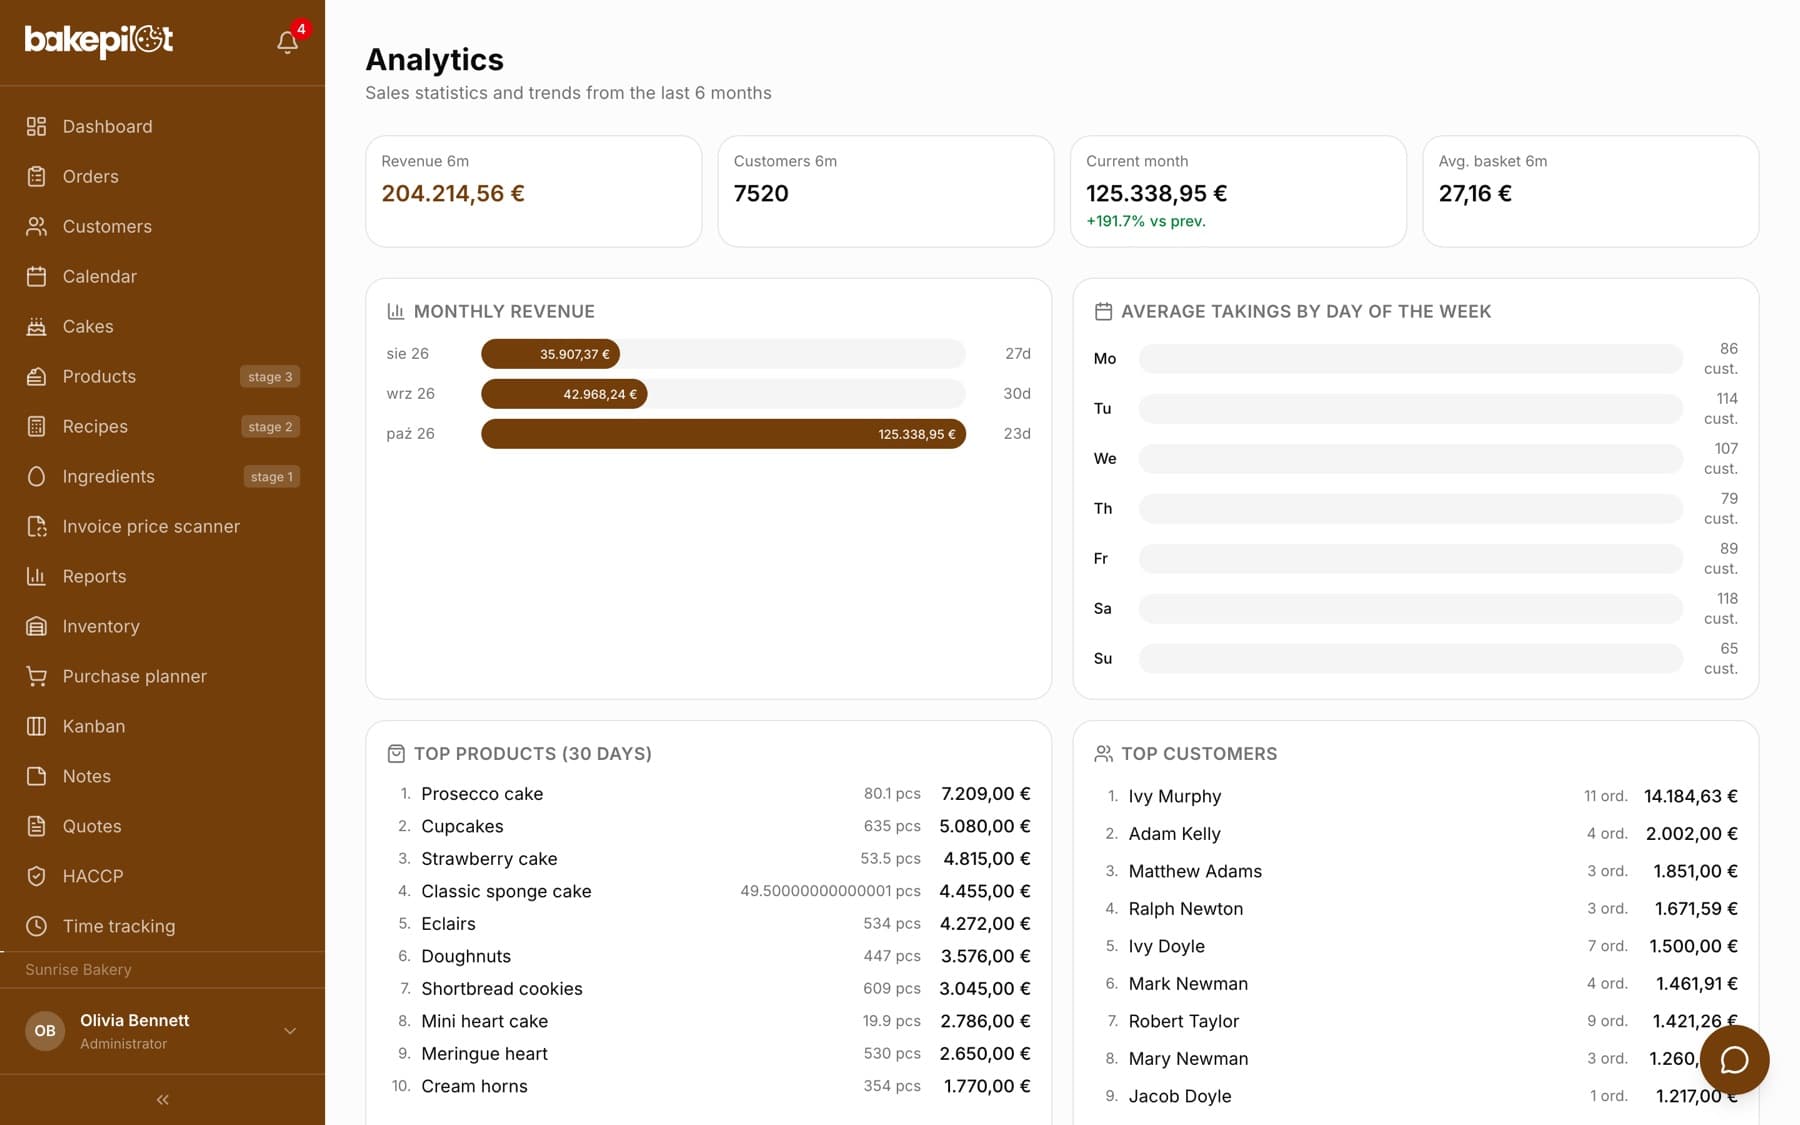
What sells best and who is your best customer? Analytics shows the 10 products with the highest revenue over the last 30 days and the 10 customers with the highest order value.
- Top 10 products over 30 days: revenue and units sold
- Top 10 customers by order value
- Order statuses over the last 30 days
Margin, in recipes and products
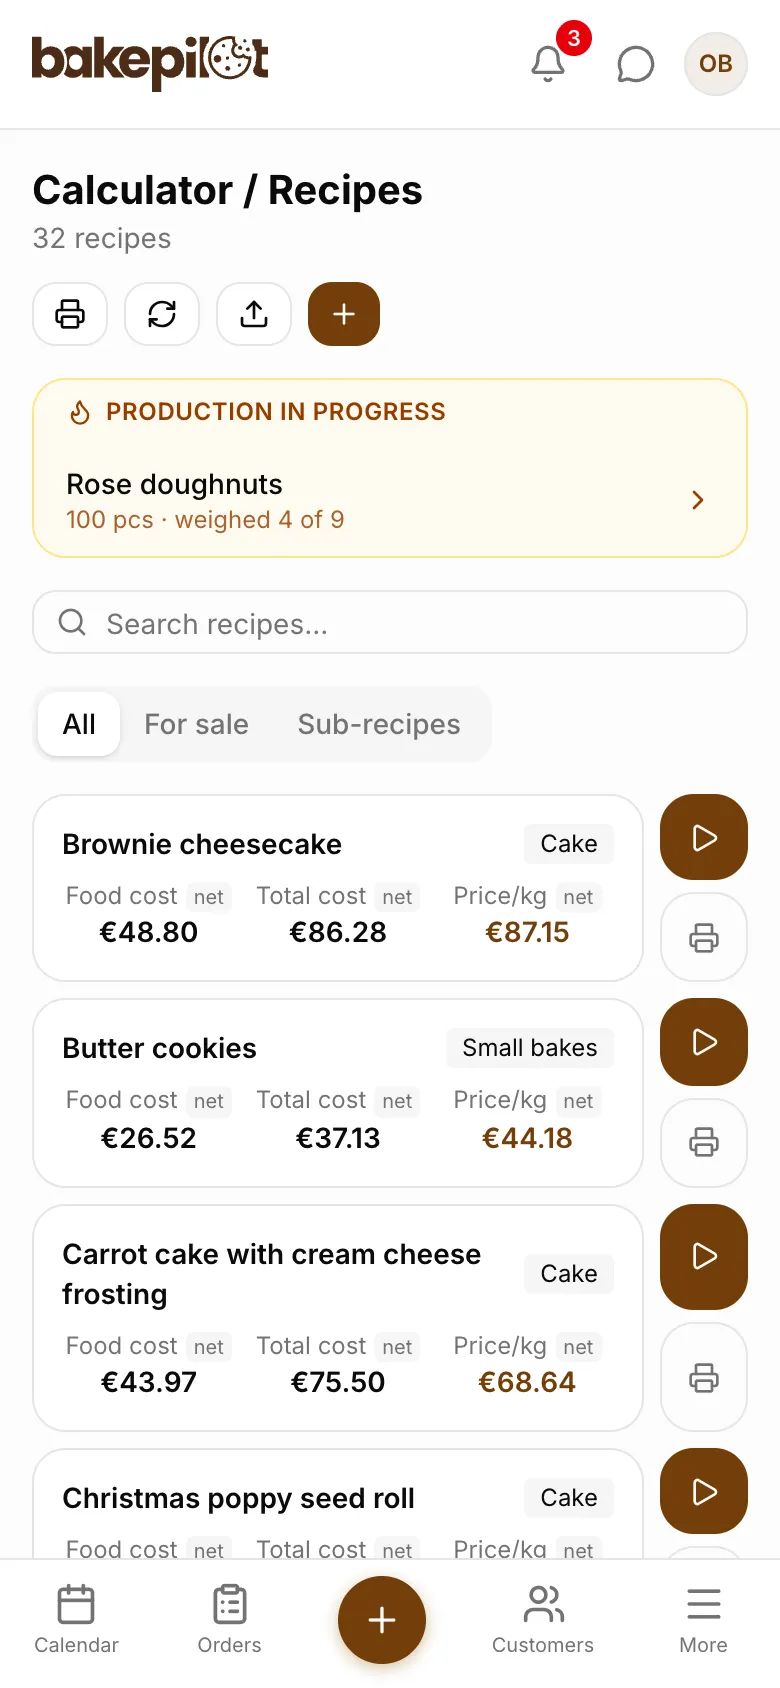
Not every bestseller is profitable. You check the margin where the cost is created: the recipe calculates the cost and margin per piece, and the product card breaks the price down into raw materials, packaging, fixed cost markup and margin.
- Total cost and margin per piece in the recipe
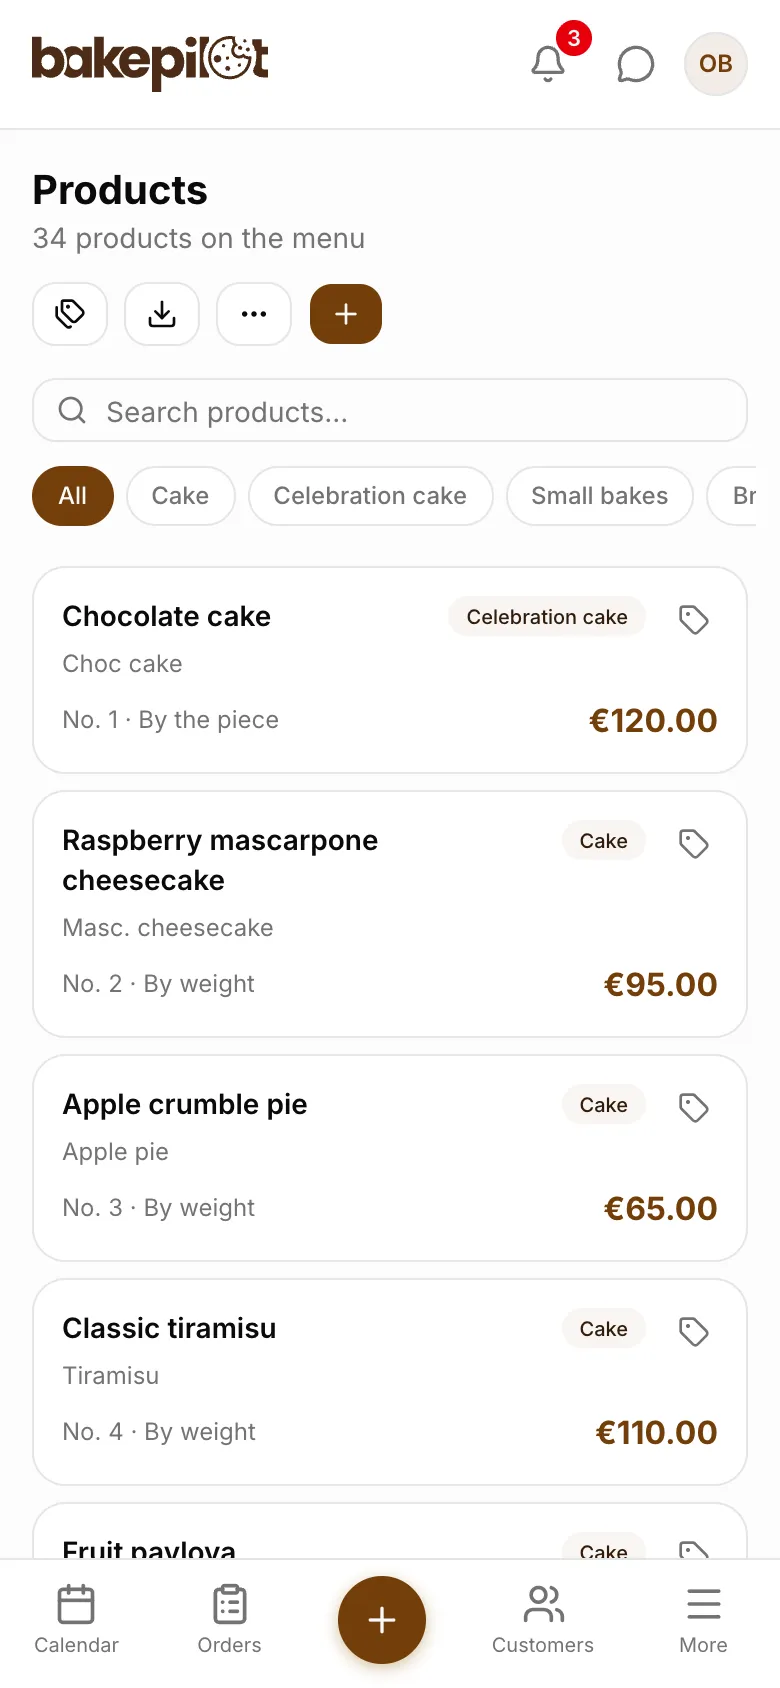
- Product price broken down into its parts
- Price suggestion based on a target margin
What's in each plan
From our pricing - the same rules apply in the app. Plan names stay in Polish, as in the app: Podstawowy (Starter), Profesjonalny (Professional) and Mistrzowski (Master). Prices in PLN per month, plus VAT.
| Podstawowy98 PLN | Profesjonalny189 PLN | Mistrzowski319 PLN | |
|---|---|---|---|
| Sales analytics and trends |
Frequently asked questions
How is Analytics different from Reports?
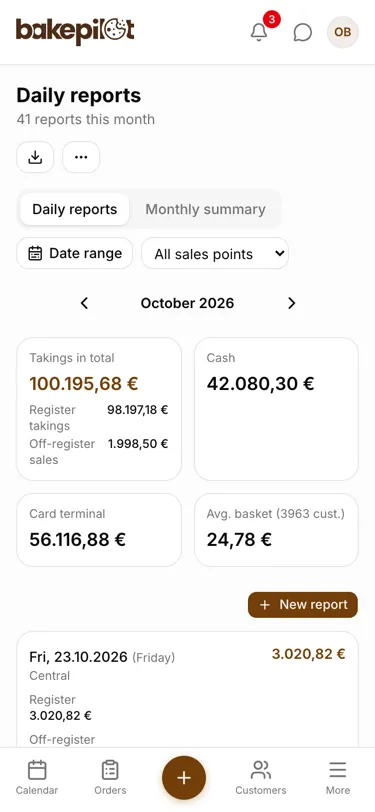
Reports are your daily takings: you enter them and review them day by day. Analytics puts the data into a bigger picture: 6 months of revenue, days of the week, best products and customers.
Do I need a lot of data for Analytics to make sense?
The more data, the better. Revenue in Analytics is calculated from daily reports, so it is worth entering your takings every day. The first comparisons become visible after 2-3 months.
See Analytics in action
Full access to every feature. 20 days free. No credit card required.